

CASE STUDY — 2018
PRODUCT DESIGN
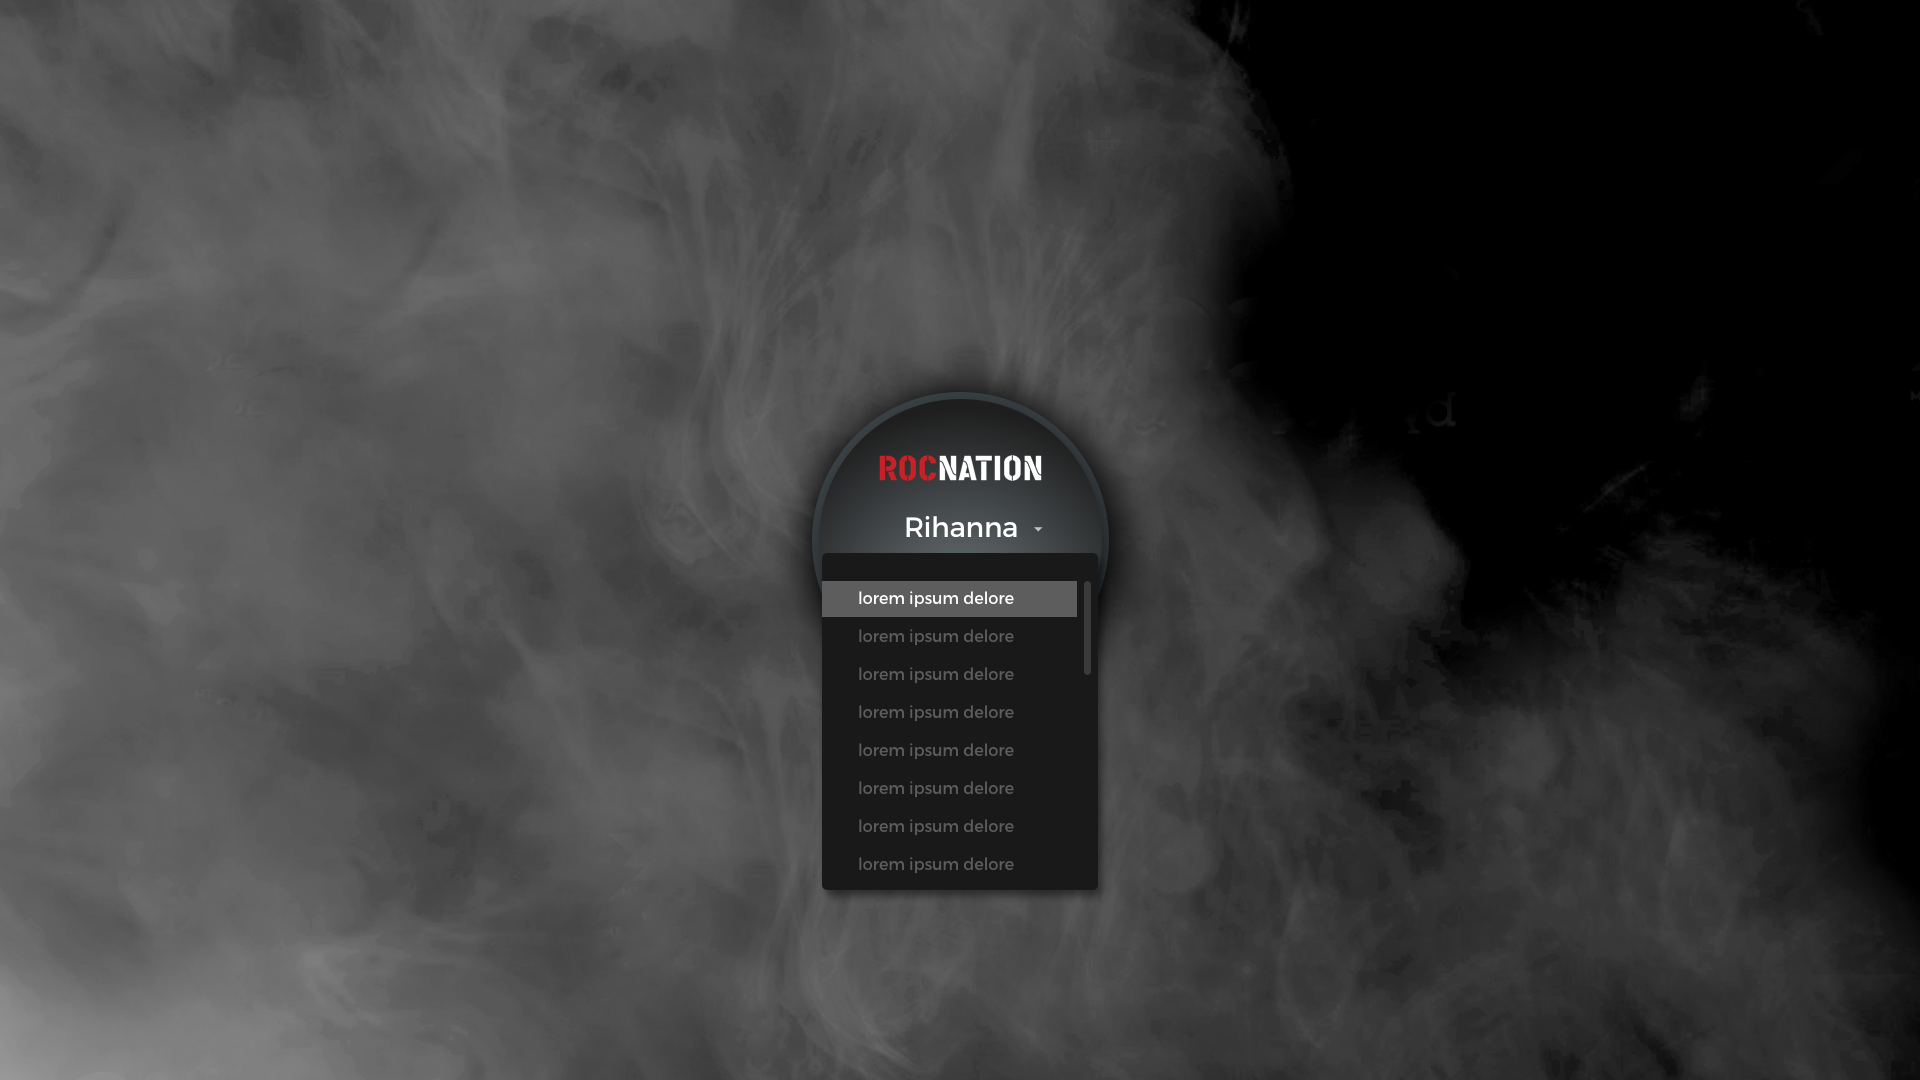
Roc Nation
Interactive Reporting Tool for Deeper Engagement
“We want a reporting tool to inform and wow artists.”
— Roc Nation
OPPORTUNITY
To maintain Roc Nation as a Spredfast customer, The Creative Solutions team and I approached Roc Nation with a social data analytics reporting tool and custom dashboard to track Roc Nation’s top influencers, artists, brands and athletes. Not only is this is a reporting tool, but an interactive touch-screen piece for performing artists and clients as they arrive at the Roc Nation Headquarters in New York City.
CHALLENGE
The challenge was to capture the magic of Roc Nation’s social content. The original premise was simple: track top influencers and find trends. Our ambitions were to create a dynamic customer experience by integrating all three social platforms (Twitter, Facebook and Instagram) that truly centralizes the channels our customer use to communicate with in a single UI.
ROLE
I lead the creative throughout the entire process from concept designs to final product. My contribution during pre-sales lead us to win business with Roc Nation. My role also involved in the UX/UI design and interaction design for each product.
HIGH-LEVEL GOALS
01 — Empower Users
Track social data (top influencers, emerging trends) for Brand Managers, Executives, Social Media Strategists and Roc Nation representatives.
02 — Easy to Navigate
Buttons will be intentionally placed to avoid any mistakes.
03 — Legible and Easy to Digest
Data must be legible and easy to understand at a distance.
04 — Engaging
Create a fun and interactive platform for deeper engagement.
Project Details
Client: Roc Nation
Duration: 13 weeks
Timeframe: 2018
Where: Spredfast (now Khoros)
Contribution
Design Lead
UX/UI Design
Interaction Design
Information Architecture
Concept Design
End-to-End Product
New Business
Wireframing & Prototyping
Team
Jessica M., Technical Project Manager and Design Manager
Michelle C., Digital Producer
Michelle B., Digital Producer
Nicole A., Digital Producer
Kevin N., Digital Director
Ricardo L., Digital Director
Dennis H., Developer
Hass A., Developer
Damon C., API Engineering Manager
Megan P., QA
Approved by Jay
Due to the success of the interactive data dashboard, Roc Nation made another request to add a desktop version as a reporting tool for internal use.
Roc Nation (and Jay) were extremely happy with the product. This was utilized as planned — social media reporting tool used internally and as a presentation — definitely a conversational piece between artists and executives when they visit the New York HQ. Roc Nation Sports is quickly expanding and has opened another office. The dashboard will be displayed over the pond at the London headquarters.
Concepting
Our Technical Project Manager and I sought the opportunity to redo the initial concepts of the dashboard made by our Digital Producer (images below). Due to our capability, flexibility to envision and mold design based on technical opportunities, this was a great way to push the envelope for Roc Nation and also help the team win new business.
Initial Concept
Initial Concept
Discovery Phase
Design Exploration
Collaboration and communication throughout the project was key. We claimed a space in the office to display user stories, social data, inspiration, business objectives and customer pain points to frame the problem space and facilitate discussions with our stakeholders. It was important that our process was inclusive, iterative, and built buy-in along the way.
Our team and I got together to study Roc Nation case studies: Budweiser Made In America 2017 Digital Recap and Jay Z’s 4:44 Campaigns. We found categories and key metrics useful for reporting. This was the starting ground for the next phase of design.
Key Metrics
Twitter
Facebook
Instagram
Total Impressions
Total Engagement
Total Reach
Total Posts
Total Followers
Top Influencers
Number of Followers
Volume Over Time
Global Activity Map
Top Cities + Countries
Top Posts
Top Terms
Demographics
Concepts presented to Roc Nation
Global Activity Map
The global activity map is the focal point. The pins grow larger as the number of conversations increase over time. We highlighted these key metrics: Top Cities, Total Engagement, Impressions, Volume Over Time and Top Posts.
Activity Over Time
The timeline is the focal point. As a reporting tool, it is important to see a spike in a conversation over time. My only concern with the timeline is when there is no activity. The purpose is to get an overview picture of what was being said, who said it, when and if it went viral.
Quadrant
The filter is the focal point and data is equally balanced. Due to the purpose of this piece, Executives, Brand managers and Digital Strategists want to interact with a dashboard easily and quickly. They can’t afford to make a mistake. The filter is intentionally placed in the center for easy access. The modules are equally balanced. An overpowering visual may hinder their storytelling and presentation.
Mid-fidelity Wireframes
Quadrant Concept
It was my recommendation that we narrow it down to the modular 4-quadrant concept. Since the design would be used on an interactive touch-screen tv. It made sense for the filter to be easily accessible. We presented it to the Roc Nation team. We got buy-in from Roc Nation! I kept in mind our user will use this during meetings with artists and executives. It had to be easy to use, visually pleasing and “mistake-proof”. Buttons had to be far apart and easy to find.


High-fidelity Wireframes
Visual Design + Iterations
I pushed the visual design as much as possible all while staying within the perimeters of the brand. At this stage, we were experimenting and refining the filter and data visualizations based on feedback.


Date Picker
Select Time Range: Quick Select or Custom Date Range
The challenge was from a technical standpoint. I had to collaborate with our developer to see if the Quick Select Date Picker was feasible. To save time while presenting, it made sense to have preselected time periods to filter through.
Development
End Product
Dennis Hadley, developer, took my initial thoughts on how to animate the smoke background. He brought it to a whole new level! Not only did he incorporate a smoke animation in the modal state, but in the Key Metrics and Influencers modules as well. I also worked alongside with Hass, developer, to tweak the typography and spacing. It had to be perfect! Check out the rest of the animation below!
Product 02
Reporting Tool on Desktop

Since Roc Nation was so pleased with the interactive experience, they requested to add a desktop version for reporting purposes. Due to budget and timeline, I went straight to design. The interactive piece was responsive. It was easy to transition to desktop since the modules were stackable, however Roc Nation wanted an export PDF functionality. This was another challenge. Since this was not part of scope, our best solution was to give them an image-based PDF.